This website uses cookies to ensure you get the best experience on our website.
Read more

APP NOTE: Using EVOM™ AutoLCI to Observe Morphological Changes and Phagocytic Activity in Macrophage Cell Line
February 24, 2023
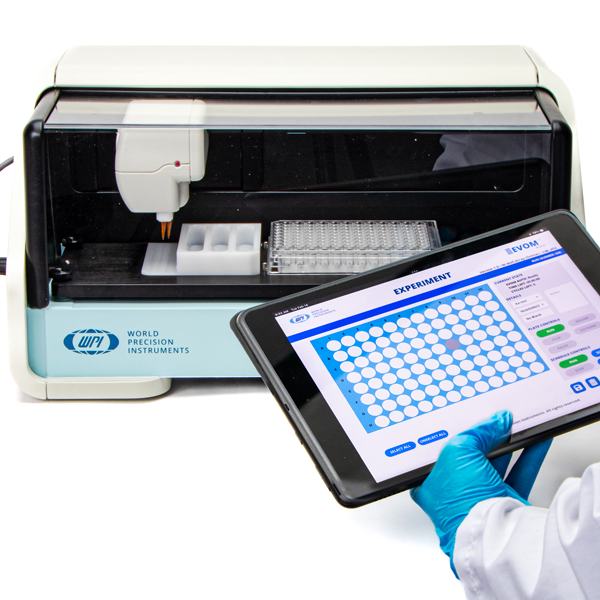
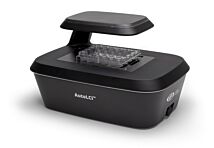
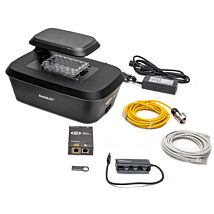
EVOM™ AutoLCI Automated Live Cell Imaging System
An integrated live cell monitoring system for stable imaging of suspension cells in immunological research
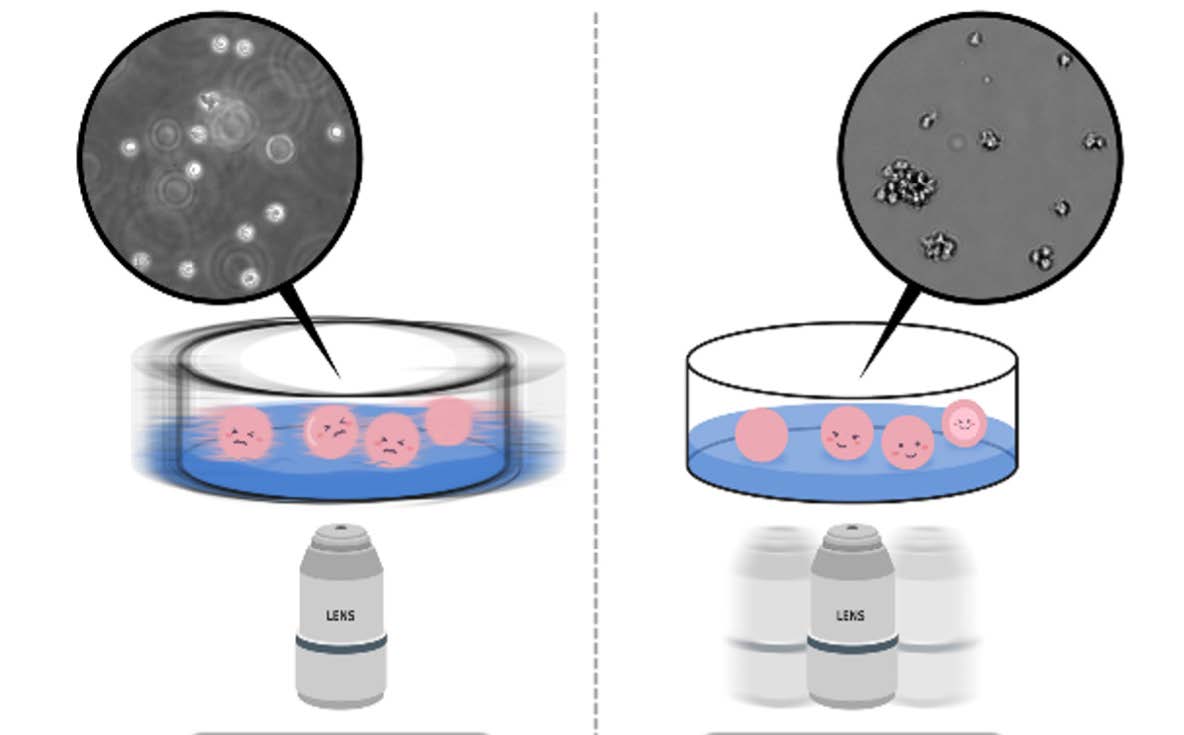
 As white blood cells responsible for immune function are suspension cells that travel along blood vessels, immunology studies often use various suspension cell lines originating from white blood cells. Dealing with suspension cells, unlike adherent cells, slight movement of a plate when locating it on the microscope causes the cells to float. Aside from the problems caused by temperature and CO2 instability, it is in fact not possible to use a traditional microscope to monitor cells in real time. Therefore, in order to stably monitor suspension cells, a live cell imaging device such as EVOM™ AutoLCI that operates inside an incubator is essential1. In addition, with EVOM™ AutoLCI, the camera inside the system moves to capture the images of cells in multiple positions to keep the cell sample in a steady state instead of having a movable stage with a plate on it. When the suspension cells were monitored both by EVOM™ AutoLCI and microscope, imaging with EVOM™ AutoLCI was more stable compared to using a microscope in which several cells were out of focus (Figure 1).
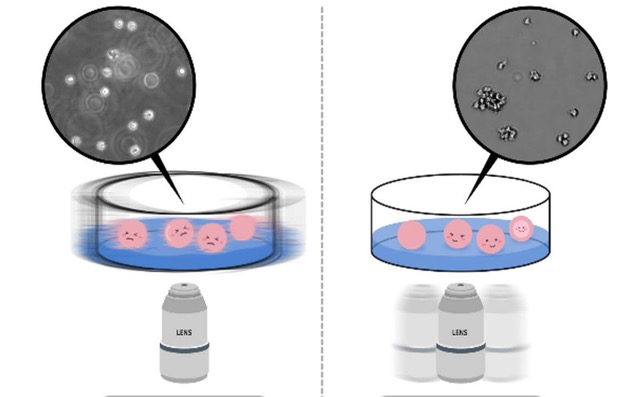
Figure 1. (Right) Advantages of using EVOM™ AutoLCI during suspension cell imaging.
For suspension cell imaging using an inverted microscope, cell fluctuation is inevitable since the sample must be taken out of an incubator, placed on the microscope stage, and be moved to locate other positions within the plate. In this process, many cells are observed to be floating off the floor and are out of focus (Left image). On the other hand, imaging with EVOM™ AutoLCI enables the entire process of imaging inside an incubator. The plate is stably fixed on the device and multiple positions within the plate can be imaged by moving the camera inside the system; thus nothing causes cell floating and no cells are observed to be out of focus (Right image).
White blood cells as a part of the immune system fight infection and defend the body against foreign materials. A first line of defense system known as innate immunity generates fast inflammatory responses to immediately prevent the spread and movement of foreign pathogens throughout the body. Because activation of the innate immune system is initiated within hours and generates rapid inflammatory responses, it is important to monitor the various cellular defenses occurring in this process in real time. An important function of innate immunity is the rapid recruitment of immune cells to an infected area. Among white blood cells, monocytes infiltrate tissues and differentiate into macrophages, while inducing an immune response against invading pathogens through phagocytosis. We performed live cell imaging with EVOM™ AutoLCI (Bright field & green fluorescence channels, 10X objective) using the Raw264.7 cell line, which represents the functional characteristics of macrophage and is well known for changes caused by lipopolysaccharide (LPS)2.
When Raw264.7 cells were stimulated by LPS, the differentiated cells increased. As round and thick cuboidal cells in a loosely adhered state were differentiated, they slowly spread and adhered more firmly in a spindle form, and this was observed through images taken every 15 minutes by EVOM™ AutoLCI (10X optics).
According to the study by Saxena et al. (2003), Raw264.7 cells stimulated by LPS differentiate into dendritic-like cells3. We confirmed through real-time monitoring using EVOM™AutoLCI that the cells adhered more firmly and became wider and flatter than the cells without the LPS treatment (Figure 2).
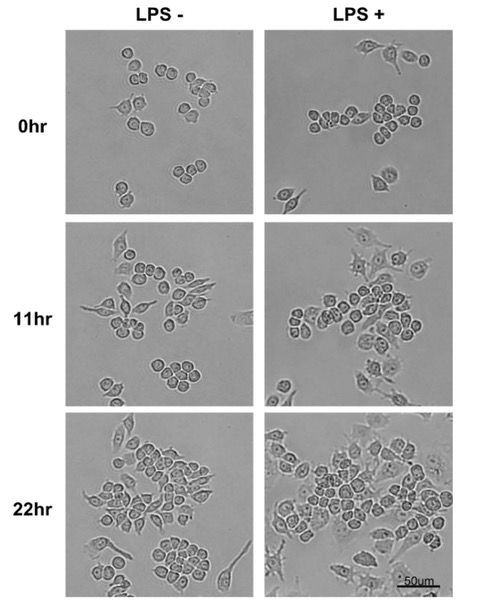
Figure 2. Monitoring morphological changes in Raw264.7 cells with LPS
This change in morphology was more visible 11 hours after LPS treatment and lasted for up to 22 hours. Also, LPS stimulation resulted in cell proliferation, which was quantified through EVOM™ AutoLCI's confluency analysis function (Figure 3).
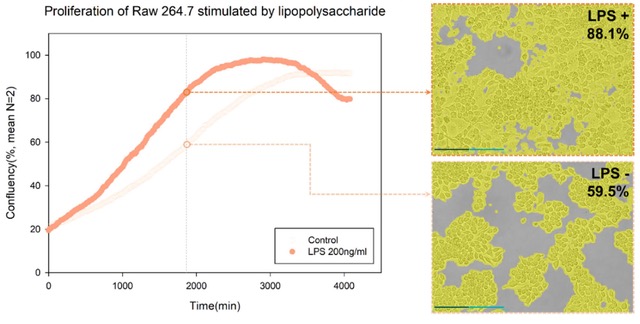
Figure 3. Growth curve of LPS-stimulated cells through confluency analysis
By using the time-lapse images (captured via EVOM™ AutoLCI, 10X optics) and analyzing the cell confluency with the AutoLCI analysis app, a cell growth graph can be obtained.
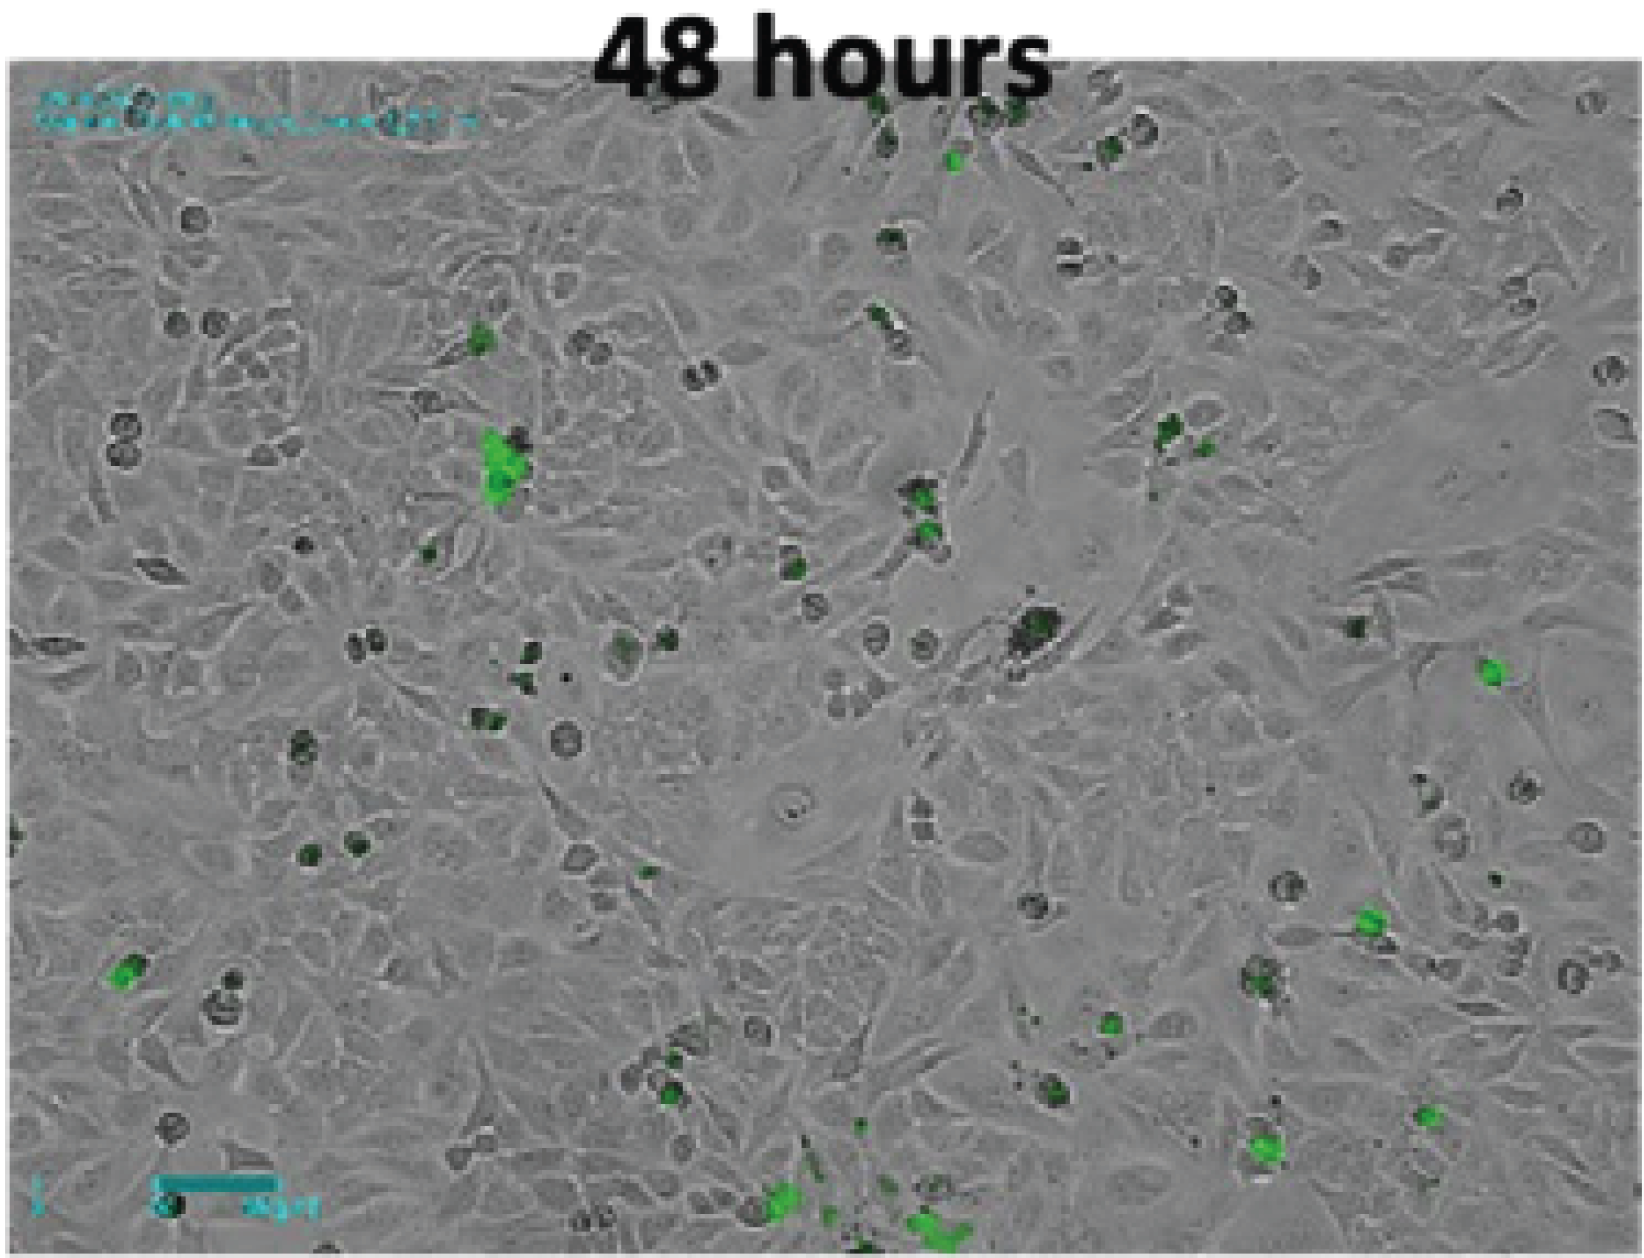
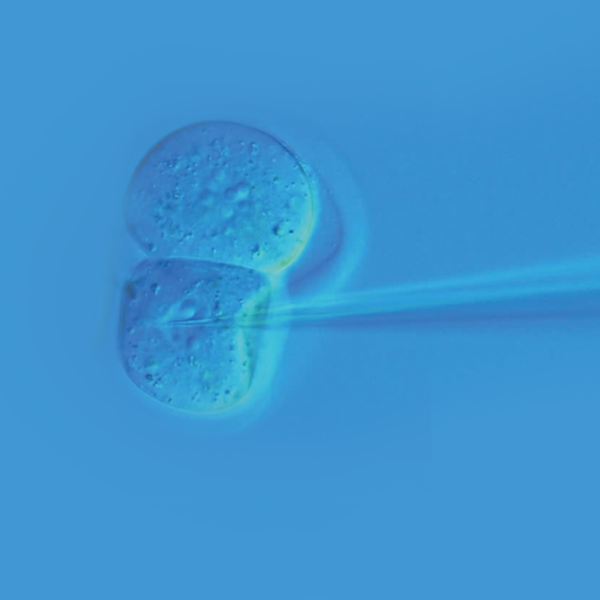
There is a report that LPS-induced activation of macrophage increases phagocytosis through the toll-like receptor 4-dependent pathway2,4. To confirm this in real time, we performed fluorescence imaging using fluorescent latex beads that were engulfed by macrophages. The 2um-sized fluorescence beads swayed easily with the slightest movement and floated above the plate. This not only decreases the bead uptake efficiency of cells but can also make imaging difficult. In fact, even commercially available phagocytosis assay kits recommend only counting bead-engulfed cells by fluorescence microscopy or flow cytometry after properly washing at the endpoint to remove non-engulfed beads5,6. In this experiment, EVOM™ AutoLCI's real-time imaging showed the entire bead phagocytosis process of the cells and the bead engulfment taking place only for the activated cells that were spread flat with LPS stimulation (Figure 4A).
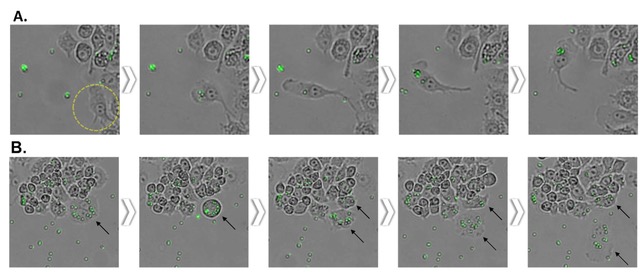
Figure 4. Phagocytosis of LPS-stimulated Raw264.7 cell observed with EVOM™ AutoLCI (Brightfield & green fluorescence channel, 10X optics)
The way these activated cells behave are expected to be possible because they efficiently move toward the beads in a spindle shape that cause directional migration compared to the round and cube-like shape before differentiation. It was also observed in real time that the beads were divided into daughter cells along with the cytoplasm when the cells were divided after bead uptake (Figure 4B).
- It was observed that the activated Raw264.7 cells after LPS stimulation engulfed the fluorescent bead. Time-lapse images were taken at a 15-minutes interval to observe cells migrate toward the bead and uptake the bead.
- The engulfed beads inside the cells are divided into daughter cells along with the cytoplasm during mitosis.
In addition, it is possible to obtain dynamic process information for various molecular environments by using the unique characteristics of the fluorescent probe. If a fluorescent dye can be additionally imaged along with the bright field imaging, it can be used for further in-depth studies. Using cell-impermeant nucleic acid stain, cytotoxicity can be evaluated through the increase in the permeability of the dye due to membrane damage during apoptosis7. And in the case of neutrophil in particular, NET formation can also be detected by nucleic acid staining8. Furthermore, it is possible to quantify the generation of reactive oxygen species9 in cells using dyes that react with reactive oxygen species or observe the intracellular acidification in the process of endocytosis and phagocytosis using pH-sensitive dye10.
Live cell imaging with EVOM™ AutoLCI enables obtaining high-resolution images of cells while eliminating physical disturbances such as cell damage or shaking. It is an automated system that functions perfectly inside an incubator, eradicating the need to move the device in and out of the incubator. Unlike other devices, EVOM™ AutoLCI doesn’t have a movable stage but instead, the camera inside the system moves to capture the images of cells in multiple positions. Since the vessel and cell samples are in a steady state, this provides a stable environment for the cells to grow and increases the success rate of cell-based research. Various types of culture vessels are compatible with the system, and it has high position reproducibility for stable scanning performance during multi-point imaging; therefore, EVOM™ AutoLCI will bring reliable results in immunology research.
Reference
- Awasthi, Bhuwan Prasad, et al. (2021) Journal of Enzyme Inhibition and Medicinal Chemistry
- Wu, Tsu-Tuan et al. (2009) Toxicology letters vol.
- Saxena, Rajiv K et al. (2003) Journal of biosciences vol.
- Taciak, Bartłomiej, et al. (2018) PloS one
- Ariganello, Marianne B., et al. (2018) International journal of nanomedicine
- Manda-Handzlik, Aneta, et al. (2018) Immunology and Cell Biology
- Riss, Terry, et al. (2019) Assay Guidance Manual [internet]
- Takishita, Yutaka, et al. (2019) Journal of Clinical Biochemistry and Nutrition
- Pal, Kunal, et al. (2019) Materials Science and Engineering: C
- Diwu, Zhenjun, et al. (1999) Chemistry & biology
FOR RESEARCH USE ONLY and not for use in diagnostic procedures. Copyright © 2022, by CURIOSIS Inc. All rights reserved.
Related Articles
-
VIDEO: EVOM™ AutoLCI - Configuring IP Settings
 Jul 13
 -
VIDEO: How to use the EVOM™ AutoLCI Software
 Feb 13
 -
APP NOTE: Observation of Mitosis using EVOM™ AutoLCI
 Mar 03
 -
APP NOTE: Analysis of Nocodazole-Induced Cytotoxicity Using EVOM™ AutoLCI
 Mar 01
 -
Improve Your Experiments with FlouroDish Cell Culture Dishes
 Aug 15
 -
Millipore Plate Compatibility Chart with EVOM Manual
 Sep 05
 -
Protect Cell Survival and Improve Research Results with Fluorodishes Cell Culture Dishes
 Jun 16
 -
The Importance of Blood-Brain Barrier Models and Measurement: A Focus on TEER
 Feb 02
 -
APP NOTE: Common Applications of the EVOM™ Auto System
 May 01
 -
NEWS: Alternatives to Animal Testing, Future of Drug Discovery
 Aug 17
Related Products
-
EVOM™ AutoLCI : EVOM™ Automated Live Cell Imaging system
As low as $22,220.00As low as $421.00As low as $166.00
Recent Posts


Close