This website uses cookies to ensure you get the best experience on our website.
Read more

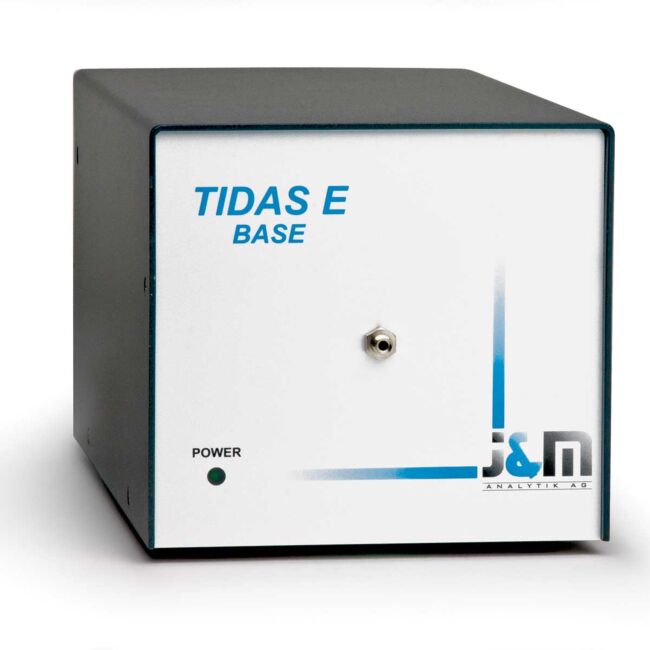
Tidas-E Base Series Photo Diode Array Spectrometer
As low as
$13,800.00
Only %1 left
Prices valid in USA, Canada, and PR only.
Order code
Price range: $13,800 - $14,025

Prices valid in USA, Canada, and PR only.
WPI’s Tidas series is a high end fiber-optic spectrometer module designed for low noise applications. The Tidas series outperforms conventional bench-based spectrophotometers and CCD-based spectrometer modules, when it comes to high precision fiber optic sampling. It relies on a monolithic optical bench made by Zeiss, which is optimized for fiber optic applications. Most cuvette-based standard spectrometers lose more than 90% of light through expensive prism decoupling. The Tidas series is designed for fiber optic sampling cells. Using suitable light sources and sample cells, spectral detection in the wavelength range of 190 to 1100 nm can be performed at noise levels < 0.04 mAU peak to peak.
Prices valid in USA, Canada, and PR only.
Features
- Low noise detection
- Fiber optic design
- An additional light source (like the D4H or FO-6000) is required
WPI’s Tidas series is a high end fiber-optic spectrometer module designed for low noise applications. The Tidas series outperforms conventional bench-based spectrophotometers and CCD-based spectrometer modules, when it comes to high precision fiber optic sampling. It relies on a monolithic optical bench made by Zeiss, which is optimized for fiber optic applications. Most cuvette-based standard spectrometers lose more than 90% of light through expensive prism decoupling. The Tidas series is designed for fiber optic sampling cells. Using suitable light sources and sample cells, spectral detection in the wavelength range of 190 to 1100 nm can be performed at noise levels < 0.04 mAU peak to peak.
Applications
The Tidas series is ideally suited for WPI’s fiber optic sampling equipment. High sensitivity detection systems for flow analysis can be assembled using WPI’s Liquid Waveguide Capillary Cells (LWCC) with effective pathlengths ranging from 50 to 500 cm. These setups are frequently used in fluid injection analysis systems for nutrient analysis (nitrite, nitrate, phosphate, iron) in oceanographic applications. Microliter sampling systems for UV/VIS applications can be assembled, using WPI’s V-Vette or DipTip™ dipping probes.
Software
There are separate software packages for data collection and data analysis for the Tidas-E. An instrument driver, TIDASDAQ, is used to run the spectrometer module, collect spectra in either single or continuous mode, control the digital I/Os and save the experimental data to disk. Data analysis is performed with the SpectraView software package. Further, TIDASDAQ exports data directly into GRAMS/AI, a feature very useful for advanced data analysis for pharmaceutical applications and requirements.
TidasDAQ 3 Labor: Data Sampling and Instrument Control
With TidasDAQ 3 Labor, high precision intensity, absorbance, transmittance or normalized spectra can be obtained in less than a second. Only a few parameters need to be adjusted to obtain spectral data. Sampling of single scans, continuous full spectra scans or triggered scans is possible. Chromatograms can be displayed and logged to disk at up to four wavelengths. Data Export of 2D and 3D Spectrograms, as well as Chromatograms is supported in ASCII, Spectralys/SpectraView, Excel and Grams/AI formats. Light sources and other sampling instrumentation can be controlled via the TTL level digital outputs, as well as data collection can be triggered by TTL leveled external inputs of the Tidas series.
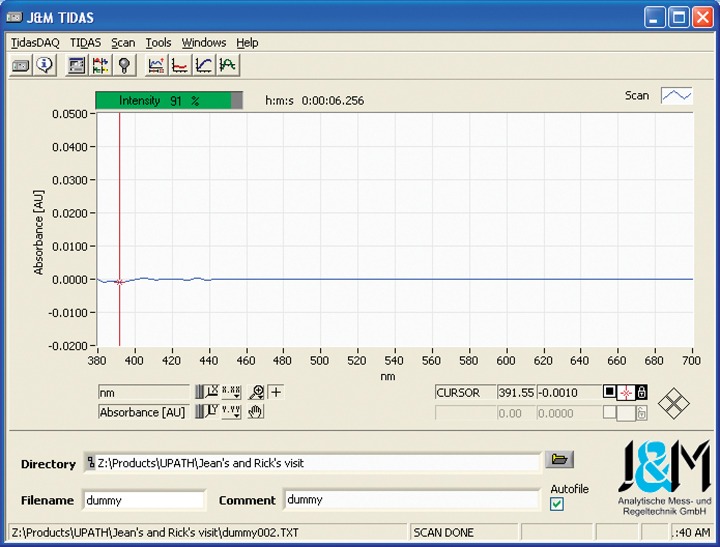
TIDASDAQ 3 Labor acquisition window, showing an absorbance spectrum. Click on the image for a bigger picture. Monitor mode. (a) Button bar, (b) Graph area, (c) Parameter area and (d) Status bar.
TIDASDAQ 3 Labor: Data Analysis
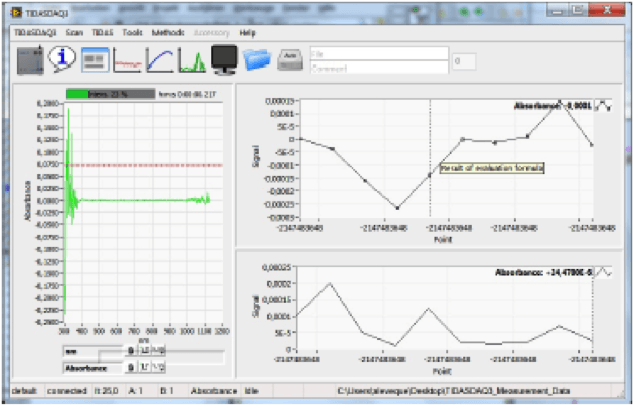
TIDASDAQ 3 Labor software now includes a spectroscopy data analysis package targeted at flow analysis applications. It processes data recorded by TIDASDAQ 3 Labor. The Analysis module allows you to display recorded spectra in 2D (default) and 3D view. Mathematical computation, Derivation, Smoothing, Quantification and other functions are available to work with your data. The Analysis module allows for single point and multiple point analysis, multiple linear regression, partial least square and principle component analysis. Data can be exported out of a 3D analysis file into separate scans. Further, chromatograms as well as spectrograms can be copied directly into Excel for further data analysis.
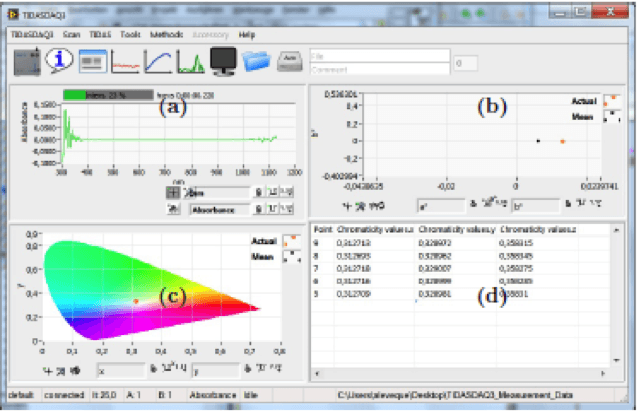
Main panel with color graphs. (a) Spectrum graph, (b) CM CIELab graph (same as CM CIELuv and CM CIELab (Hunter) types), (c) CM CIE graph and (d) CM Table. Graphs are set through setup window.
DNA/RNA Quantification with:
• 2mm cuvette
• DipTipMini
| SKU | VAR-3559 |
|---|
Related Articles
-
VIDEO: How to Download and Delete a Data File on the EVOM™ Auto
 Apr 13
 -
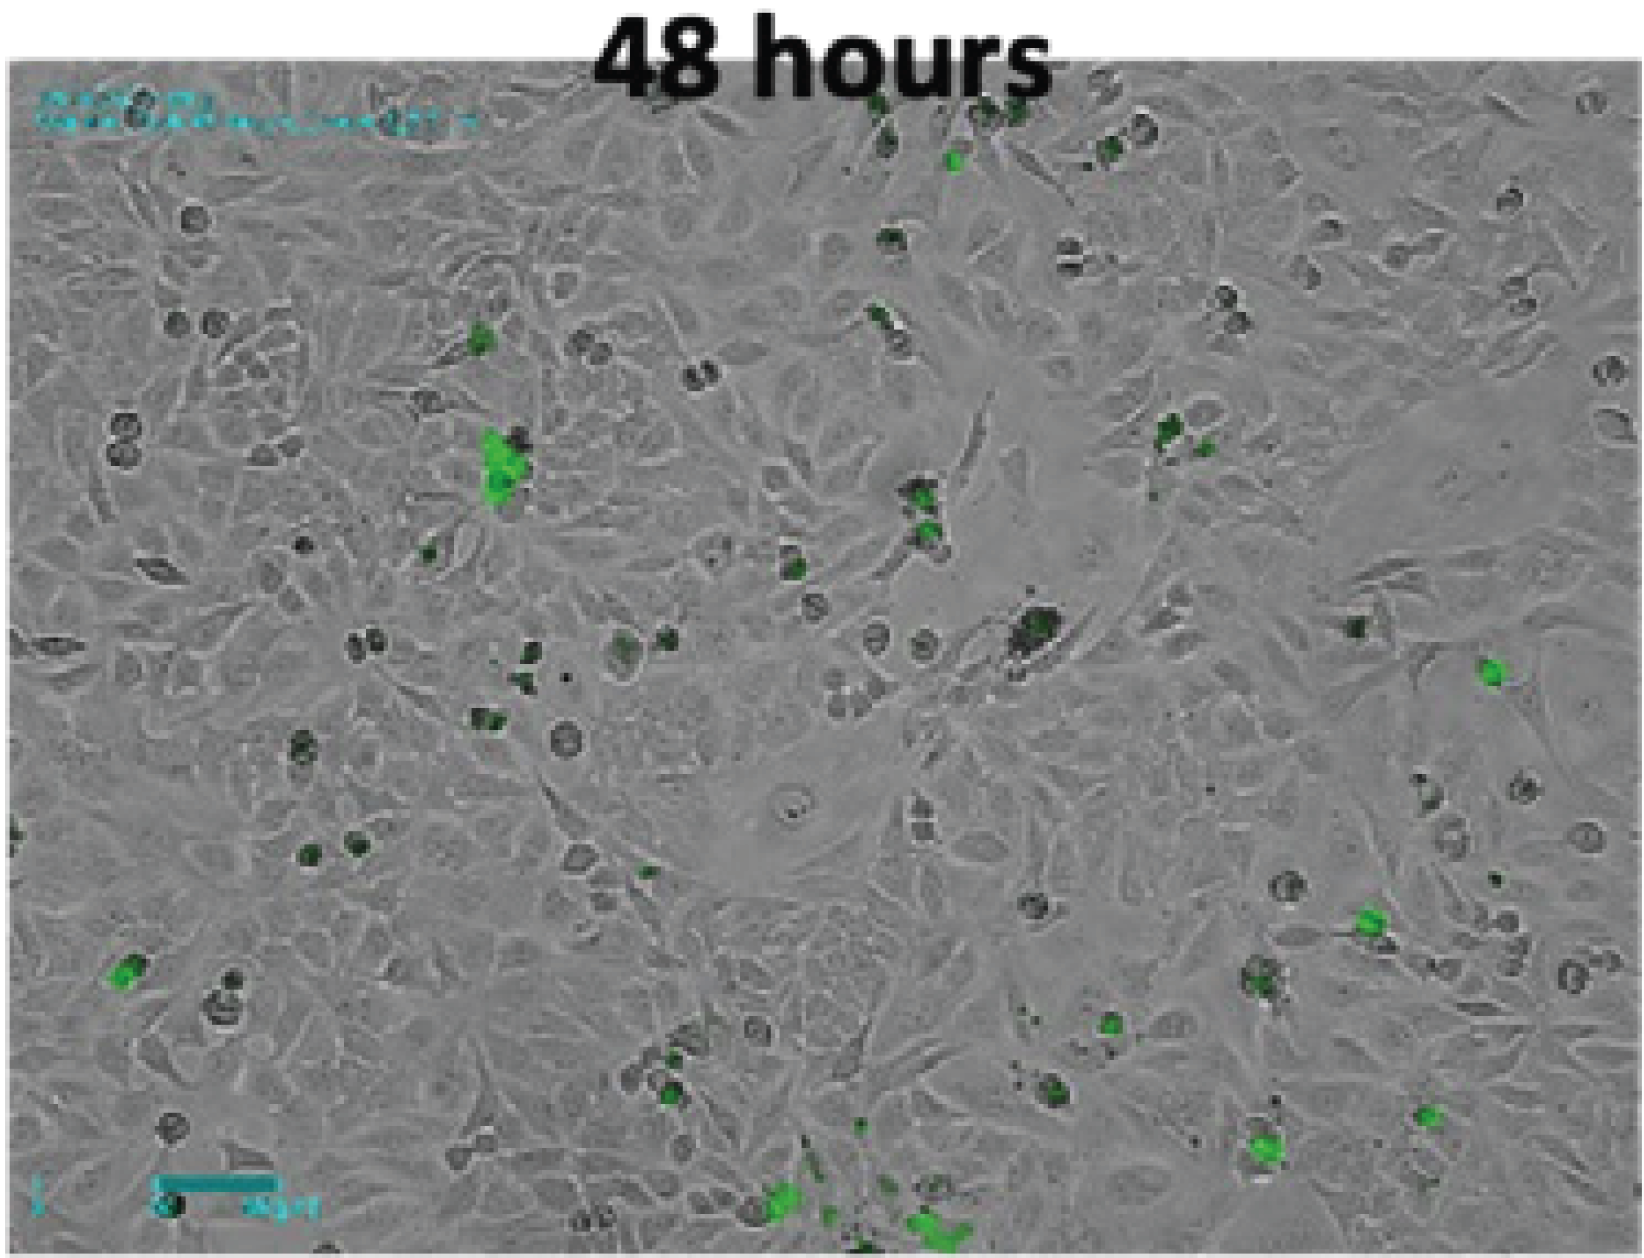
APP NOTE: Analysis of Nocodazole-Induced Cytotoxicity Using EVOM™ AutoLCI
 Mar 01
 -
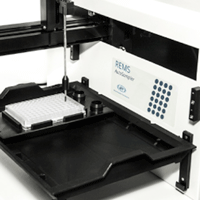
How to Upgrade Your REMS Software for Automated TEER Measurement
 May 05
 -
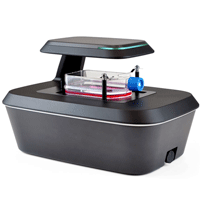
VIDEO: How to use the EVOM™ AutoLCI Software
 Feb 13
 -
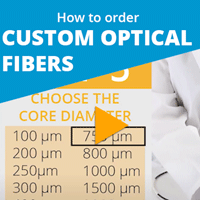
How to Order Custom Qualified Optical Fiber
 May 21
| OPTICAL BASICS | Monolithic Spectrometer Module; Concave Aberration Corrected Holographic Grating; Fiber optic cross section converter for increased light throughput; 2nd order multilayer filter |
| DETECTOR ARRAY | Hamamatsu photodiode array, 256 pixel |
| WAVELENGTH RANGE: | 190 - 720nm |
| SPECTRAL BANDWIDTH (FWHM) | |
| DETECTOR RESOLUTION | 16 Bit |
| NOISE (PEAK TO PEAK)* | < 0.04mAU @ 254nm |
| WAVELENGTH ACCURACY | < 1nm |
| WAVELENGTH REPRODUCIBILITY | < 0.1nm |
| FIBER OPTIC INPUT | 600µm |
| SYSTEM REQUIREMENTS | Windows XP, Vista |
| SOFTWARE (INCLUDED) | TIDASDAQ (data collection) & SpectraView (data analysis) |
| DIMENSIONS (WxHxD) | 260 × 150 × 140mm (10.25 × 5.9 × 5.5") |
| WEIGHT | 2.5kg (5.5 lb) |
| INTERFACE | External (RJ-45) |
| POWER | 100-240V/50-60Hz |
| Wave length range | Resolution | Wavelength accuracy |
Light source | SKU |
| UV 190-390 nm | < 3 nm | ±1 nm | no | 505066 |
| UV/VIS 190-720 nm | < 7 nm | ±1 nm | no | 505067 |
| VIS/NIR 300-1100 nm | < 10 nm | < 3 nm | no | 505068 |
| Descriptions | |
| Number of pixel | 256 |
| Integrated cuvette holder |
No |
| Dimensions | 260 x 150x 140 mm (L x B x H) |
| Weight | 2,5 kg |
| Power supply | 100 - 240 VAC / 47 - 63 Hz |
| Digital I/O | 2 x IN / 2 x OUT |
| Optical fiber connection |
SMA 905 |
| Included in delivery | Power supply, Software TIDAS DAQ, Manual, Patchkabel RJ 45 |
Related Products
Check items to add to the cart or
-
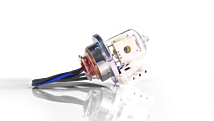
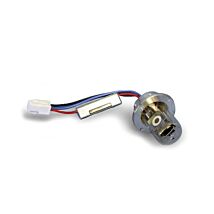
LAMP DEUTERIUM D4H REPLACEMENT
$1,558.00 -
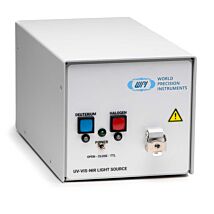
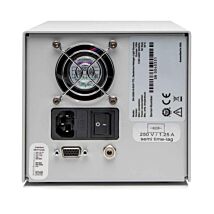
Deuterium/Halogen LIGHT SOURCE
$8,425.00 - $1,050.00
-
Photo Diode Array (PDA) Spectrophotometer System
As low as $17,000.00