This website uses cookies to ensure you get the best experience on our website.
Read more

LabScribe Software for LabTrax
May 01, 2013
LabScribe is the powerful software included with Lab-Trax™ (formerly called DataTrax). The acquisition and data display in LabScribe is easy and straight forward. It supports real units and a time-based display that is not coupled to sample rate. You can display up to 1,000,000 data points per channel on the screen. Scrolling, zoom-in and zoom-out tools, together with a searchable list of user interventions, make finding important areas of data easy. And, of course, you can print or export anything that you see.

The Main Display
Data recorded with LabScribe is presented as distance-per-unit of time (for example, cm/sec) exactly as it would be on a traditional paper chart recorder. The x-axis display is compressed or expanded using point and click icons in the LabScribe toolbar. LabScribe ’s display can smoothly scroll data at any speed. The display scroll rate is not determined by sampling rate, so you have full control over resolution and display. This is particularly useful when you want to compress high-resolution data on the time axis to create a data overview. Currently the software can display 100,000 points per channel online and one million points per channel offline, so you can see quite a bit of data at a glance.

Main display window showing all eight channels.
LabScribe ’s Main Window currently supports functions that can show you the real-time rate, integral or any of 16 online analyses. Each of these is set up from a single click in the Main Window. LabScribe also has an “Analysis Window” where students can make more in-depth measurements and build lab reports. There are 31 different kinds of measurements supported in this window.
AutoScale
A single button allows you to find the data on a channel, wherever it is, center it and expand it to fill the available channel space. AutoScale used with high-resolution recorders ensures that you will never again lose data because they are “out of range or off scale.“
Cursors
 Most measurements students make on recorded data involve a distance in time or a difference in amplitude. For this reason, LabScribe places two easy-to-move cursors in each display of data. LabScribe displays the difference in time and the difference in voltage (or calibrated units) between the cursors. Cursors can be moved with the mouse, or for precise placement, with the arrow keys on the keyboard.
Real World Units
LabScribe allows you to calibrate the displayed data in any unit that you choose. Reading your data in mmHg or grams or micro amps takes the guesswork out of analysis.
Real-Time Marks
Researchers can insert “Text Marks” from the keyboard into their data to indicate when events like drug delivery or stimulus points are occuring. Marks are easy to search and the ”Go To Mark” feature will take you to a selected event from anywhere in the data. For reporting, researchers can position the text in a given mark over the data it applies to, just like writing on chart paper.

Marking window.
Twin DACs (WPI-118 only)
LabScribe allows you to program two independent analog outputs. They can be used as independent stimulator outputs, or as linear controls for pumps or other hardware that accept an analog voltage as control. Built-in wave protocols include pulse, step, pulse train and DC. The two outputs can be combined to produce more complex protocols.

Stimulator window.
Digital Inputs
Up to eight digital inputs can be configured from LabScribe. Raw data, count frequency and open times can be displayed in real time.
Digital Output
Up to eight digital outputs can be configured from the LabScribe software. Digital outputs can be used to control valves or relays in the experimental rig, or they can be configured in parallel to control serial devices.
Output sequences of events are created from an easy-to-use sequence builder that can include both the digital outputs and the analog outputs. Sequences are remembered by LabScribe and can be called manually or automatically.

Input/Output window.
Lab Settings
Settings or templates for the various lab protocols are stored in the program’s settings menu. Each setting can include a Lab procedure and Journal format, as well as the program acquisition and analysis settings. This makes changing program settings to accommodate different experiments point-and-click easy.
Free Upgrades and Built-in Site License
LabScribe software upgrades are free. Better yet, LabScribe may be freely distributed and copied to other lab computers.
That means that researchers can record data in the lab and work on analysis and lab reports at their leisure in different locations.
LabScribe is provided on an open license so you can record data in the lab and analyze it in your office without buying multiple copies of the software.
Related Articles
-
Data Acquisition Designed for Muscle Physiology Pre-Clinical Trials
 Oct 20
 -
VIDEO: Setting up the 3D SpectaSCOPE™ - Part 1
 Feb 23
 -
WPI's Low-Noise Amplifiers Outperform Cheap Imitations
 Apr 30
 -
Choosing the Correct Pump
 Jun 16
 -
How to Upgrade Your REMS Software for Automated TEER Measurement
 May 05
 -
FAQs about TEER Measurement
 Feb 02
 -
REMS High Throughput TEER Robot Gets Software Upgrade
 May 30
 -
Recording TEER Measurements from an EVOM2
 Nov 11
 -
Choosing a Temperature Probe
 Apr 30
 -
EVOM™ Auto: Fix Software Switching Modes
 May 25
Related Products
-
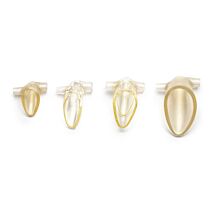
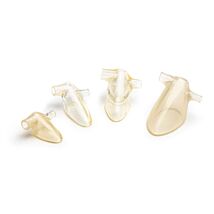
Facemask with supply and exhaust ports for Anesthesia
As low as $150.00Blood Pressure Measurement for Rodents
As low as $6,900.00
Recent Posts


Close