This website uses cookies to ensure you get the best experience on our website.
Read more

DNA/RNA Quantification Using DIPUV-Mini and a Tidas Spectrometer
May 01, 2013
Abstract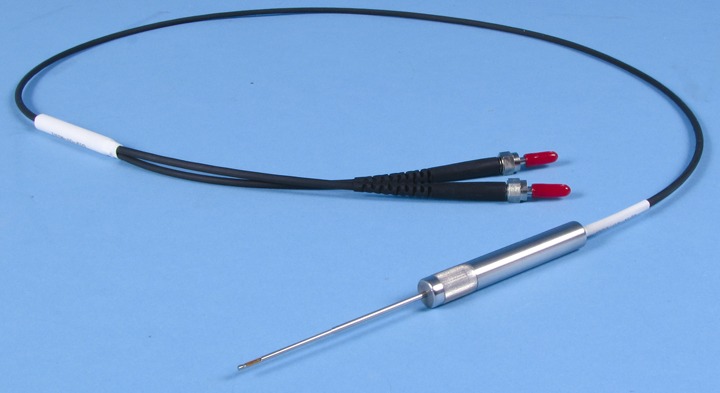
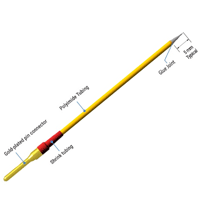
Concentrations of DNA in solution (31µg/mL and 688µg/mL) were measured with a spectrometer and UV/VIS light source in a DIPUV-Mini. Due to the 2mm pathlength, use of a DIPUV-Mini does not require a pre-measurement dilution within this concentration range, thus a potential source of error was eliminated.
Experimental Procedure

Standard solutions of DNA (Sigma D1626) were prepared gravimetrically using 18.2MΩ/cm ultrapurified water as a solvent. Solutions were prepared between 0.0µg/mL and 687.6µg/mL.
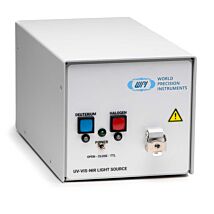
Measurements were taken in triplicate using a DIPUV-Mini. The DIPUV-Mini was connected to a UV/VIS light source (WPI #D4H).
Data were collected in 1nm increments across the full range of the instrument (190nm-720nm). The instrument was configured such that reference measurements yielded an 80% total intensity. All measurements utilized 18.2MΩ/cm ultrapurified water as a reference solution.
Results
Experimental results are presented in Table 1:
| DNA [µg/mL] | Absorbance @260nm [AU] |
| 0.00 | -0.0017 |
| 30.83 | 0.1116 |
| 56.59 | 0.1945 |
| 85.49 | 0.3012 |
| 115.66 | 0.3821 |
| 143.94 | 0.4551 |
| 281.63 | 0.8399 |
| 428.91 | 1.2409 |
| 561.15 | 1.5639 |
| 687.61 | 1.7340 |
Table 1: DNA Concentrations and Resultant Absorbance Values
Since absorbance with respect to concentration follows the Beer-Lambert Law,
A= εlc
expected absorbance values were calculated from the DNA solution concentrations. Literature values of ε for dsDNA are listed as 0.020µg/ml*cm.
Experimental data can be found in Figure 1 with the calculated absorbance measurements indicated by a solid line. Absorbance measurements are expressed at a 260nm wavelength. Deviation from the theoretical value at higher absorbance values is a result of stray lightinterference within the spectrometer.
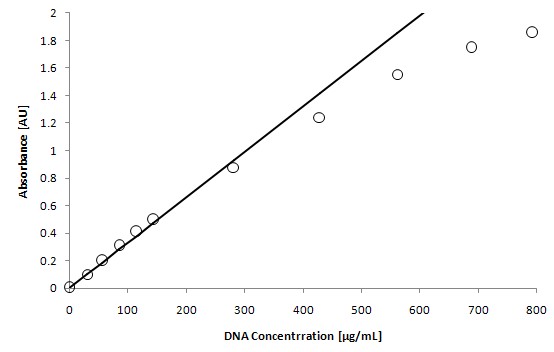
Figure 1: Measured versus Theoretical Absorbance
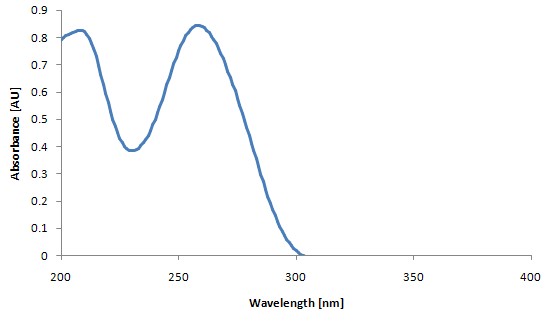
Figure 2: Typical DNA Measurement (281.6µg/mL)
Related Articles
-
DNA/RNA Quantification Using a 2mm Cuvette and a Tidas Spectrometer
 May 01
 -
Metal Electrode Selection Guide for Profile C
 Apr 26
 -
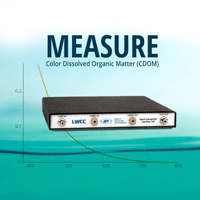
Easily Measure Colored Dissolved Organic Matter (CDOM)
 Oct 08
 -
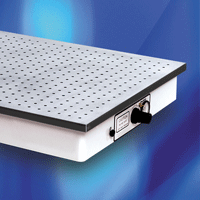
Vibration Free Workstation/Platforms Defined
 May 01
 -
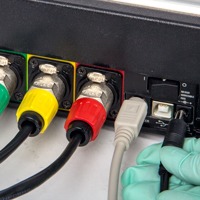
Choosing Cables and Connectors
 Apr 25
 -
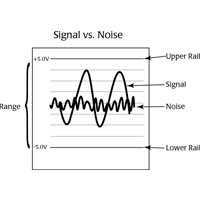
WPI's Low-Noise Amplifiers Outperform Cheap Imitations
 Apr 30
 -
VIDEO: Setting up the 3D SpectaSCOPE™ - Part 1
 Feb 23
 -
Metal Electrode Selection Guide for Profile A
 Apr 26
 -
Biosensor Specifications
 Apr 29
 -
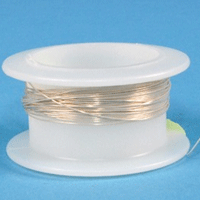
Precious Metals and Specialty Wire
 Apr 25
Related Products
-
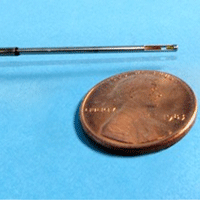
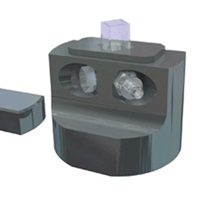
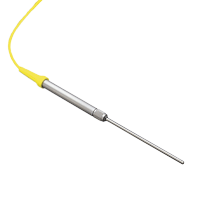
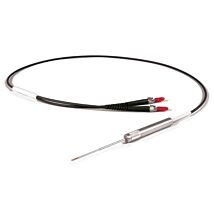
Smallest Fiber Optic Dipping Probe
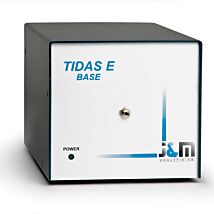
As low as $2,670.00Tidas-E Base Series Photo Diode Array Spectrometer
As low as $13,800.00
Recent Posts

Close